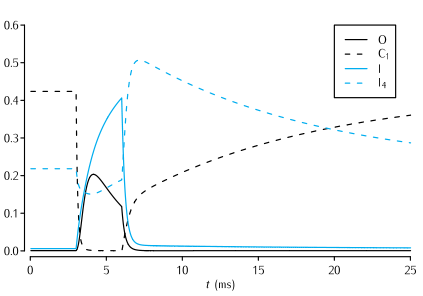
Time evolution of a selection of the state variables in the Vandenberg and Bezanilla (1991) model of the sodium channel in response to a 3 ms long voltage pulse from -65 mV to -20 mV, and back to -65 mV. See Scheme 5.7 for the significance of the state variables shown. In the interests of clarity, only the evolution of the state variables I, O, I4 and C1 are shown.
Figure 5.12

The Vandenberg and Bezanilla (1991) model of the sodium channel
Simulation environment:
Notes
To reproduce the simulation:
- In the I/V Electrode window click on the VClamp checkbox
- In the Run Control window click on Init & Run
To view the channel's kinetic scheme, in the ChannelBuild[0] window click on highlighted text O: 9 state, 9 transitions.
Download:
