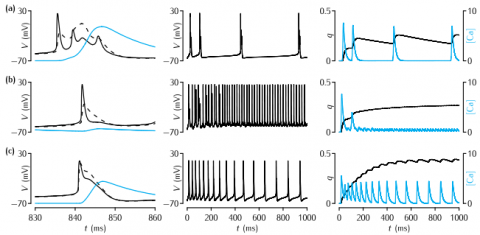
Behaviour of the Pinsky-Rinzel model for different values of the coupling parameter gc and the level of somatic current injection Is. In each subfigure, the left-hand column shows the detail of the somatic membrane potential (solid line), the dendritic membrane potential (dashed line) and the calcium concentration (blue line) in a period of 30 ms around a burst or action potential. The middle column shows the behaviour of the membrane potential over 1000 ms. The right-hand column shows the behaviour of q, the IAHP activation variable, and the calcium concentration over the period of 1000 ms. The values of Is in mA cm-2 and gc in mS cm-2 in each row are: (a) 0.15, 2.1; (b) 0.50, 2.1; (c) 0.50, 10.5.
Figure 8.2
Pinsky-Rinzel neuron
Simulation environment:
Notes
To recreate the data in panel (a):
- In the RunControl window click on Init & Run
- In Graph[0] (top) the membrane potential in the soma (black) and the dendrite (red) will appear. In Graph[2] (middle) the q variable appears. In Graph[1] (bottom) the dendritic Calcium trace appears.
To recreate the data in (b) change Is in the Parameters window to 0.0050.
To recreate the data in (c) change gc in the Parameters window to 10.5. To see the q trace you will need to right-click in Graph[2] and select View...->View=Plot.
Download: