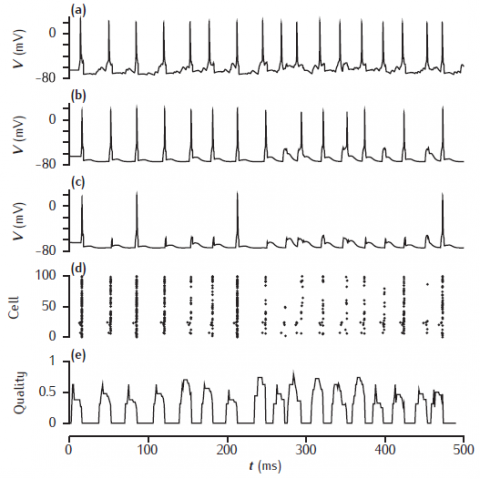
Network simulation based on the model of Sommer and Wennekers (2001). The top three traces are the time courses of the membrane potential of three excitatory neurons: (a) a cue cell, (b) a pattern cell and (c) a non-pattern cell. (d) a spike raster of the 100 excitatory neurons. (e) the recall quality over time, with a sliding 10ms time window.
Figure 9.10
Biophysical associative memory model
Simulation environment:
Notes
Simulation produces somatic voltage plots from a cue cell, a non-cue pattern cell and a non-pattern cell. The "Spike plot" button on the menu panel will show a raster plot of all spiking activity during the simulation.
Download: