Three waveforms for synaptic conductance: (a) single exponential decay with τ = 3 ms, (b) alpha function with τ = 1 ms, and (c) dual exponential with τ1 = 3 ms and τ2 = 1 ms. Response to a single presynaptic action potential arriving at time=1ms. All conductances are scaled to a maximum of 1 (arbitrary units).
Figure Code examples.all

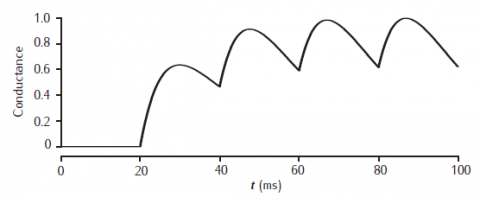
Alpha function conductance with τ = 10 ms responding to action potentials occurring at 20, 40, 60 and 80 ms. Conductance is scaled to a maximum of 1 (arbitrary units).
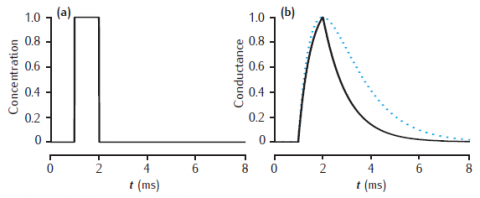
Response of the simple 2-gate kinetic receptor model to a single pulse of neurotransmitter of amplitude 1 mM and duration1 ms. Rates are α = 1 /mM.ms and β = 1 /ms. Conductance waveform scaled to an amplitude of 1 and compared with an alpha function with τ = 1 ms (dotted line).
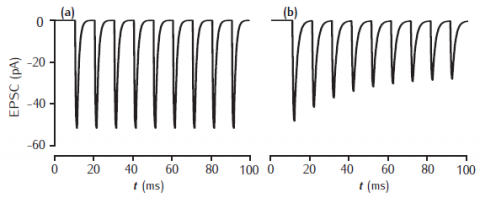
Postsynaptic current in response to 100Hz stimulation from (a) 2-gate kinetic receptor model, α = 4 /mM.ms, β = 1 /ms; (b) 5-gate desensitising model, Rb = 13 /mM.ms, Ru1 = 0.3 /ms, Ru2 = 200 /ms, Rd = 10 /ms, Rr = 0.02 /ms, Ro = 100 /ms, Rc = 1 /ms. Each presynaptic action potential is assumed to result in the release of a vesicle of neurotransmitter, giving a square-wave transmitter pulse amplitude of 1 mM and duration of 1 ms. The current is calculated as Isyn(t) = gsyn(t)(V(t) − Esyn). Esyn = 0 mV and the cell is clamped at −65 mV. The value of gsyn(t) approaches 0.8 nS on the first pulse.

Facilitation of release probability in the basic phenomenological model. Stimulation at 50Hz with p0 = 0.1, dp = 0.1 and τf = 100 ms.
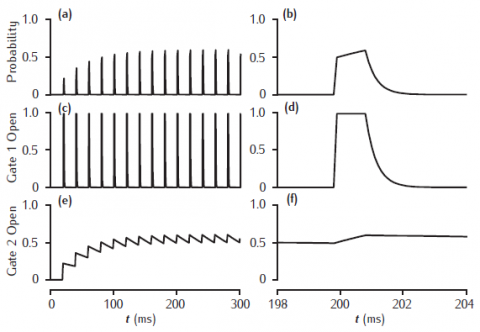
Facilitation of transmitter release in a kinetic 2-gate model. Left-hand column shows stimulation at 50 Hz. Right-hand column shows release and gating transients at the tenth pulse. Fast gate: k+1 = 200 /mM.ms, k−1 = 3 /ms; Slow gate: k+2 = 0.25 /mM.ms, k−2 = 0.01 /ms; square-wave [Ca2+]r pulse: 1 mM amplitude, 1 ms duration.
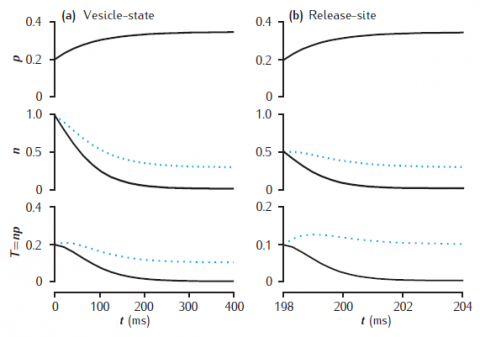
Facilitation and depression in deterministic models of short-term synaptic dynamics. Phenomenological model of facilitation: p0 = 0.2; Δp = 0.05; τf = 100 ms. (a) vesicle-state model: k∗n = kr = 0.2 /s. (b) release-site model: nT = 1; kn = kr = 0.2 /s. Solid lines: ns = 0; dotted lines: ns = 0.1. Synapse stimulated at 50Hz.
Unzip file and run runsynnp_rv.m in MATLAB.
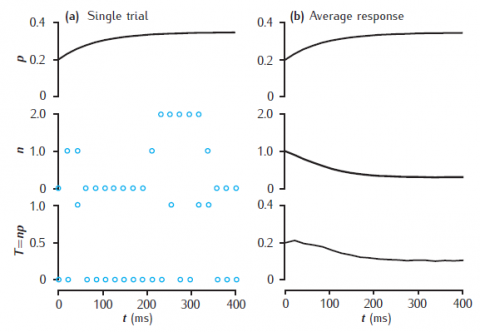
Stochastic vesicle-state model of short-term dynamics at a single synaptic active zone. (a) A single simulation run, showing the release probability p, the actual number of releasable vesicles, n (initially 1), and neurotransmitter release, T. (b) Average values of these variables, taken over 10000 trials. Phenomenological model of facilitation: p0 = 0.2; Δp = 0.05; τf = 100 ms. Vesicle-state model: k∗n = kr = 0.2 s−1; ns = 0.1. Synapse stimulated at 50Hz.
Unzip file and run runsynnp_rvs.m in MATLAB. Results may not be identical to the figure as this is a stochastic model and the results depend on the random number generator and its seed.

Three distinct trials of a complete synapse model with 500 independent active zones. Each active zone uses the stochastic vesicle-state model of short-term synaptic dynamics combined with the 2-gate kinetic model of AMPA receptors. Phenomenological model of facilitation: p0 = 0.2; Δp = 0.05; τf = 100 ms. Vesicle-state model: k∗n = kr = 0.2 s−1; ns = 0. 2-gate kinetic receptor model: α = 4 mM−1ms−1, β = 1 ms−1. Esyn = 0 mV, with postsynaptic cell clamped at −65 mV. Synapse stimulated at 100Hz.
A different result appears each time you run the simulation, since it is a stochastic model.
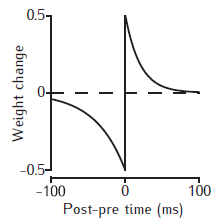
Example STDP weight change curves. The weight is increased if the postsynaptic spike occurs at the time of, or later than the presynaptic spike; otherwise the weight is decreased. The magnitude of the weight change decreases with the time interval between the pre- and postsynaptic spikes. No change occurs if the spikes are too far apart in time.
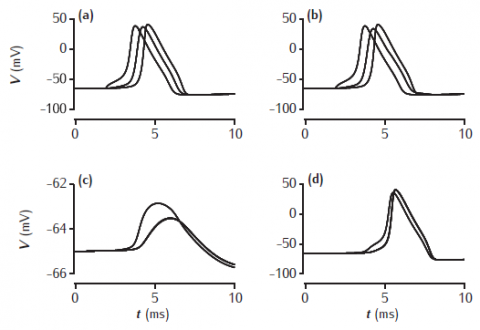
Simulated action potential travelling along two axons that are joined by a gap junction half-way along their length. Membrane potentials are recorded at the start, middle and end of the axons. (a,b) Axon in which an action potential is initiated by a current injection into one end. (c) Other axon, with a 1 nS gap junction. (d) Other axon, with a 10 nS gap junction. Axons are 100 μm long, 2 μm in diameter with standard Hodgkin-Huxley sodium, potassium and leak channels.
Set value of r in both Ggap panels to appropriate value. This resistance is in MOhms, so 100 MOhms is 10 nS and 1000 MOhms is 1 nS.
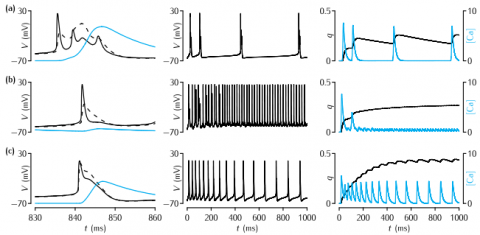
Behaviour of the Pinsky-Rinzel model for different values of the coupling parameter gc and the level of somatic current injection Is. In each subfigure, the left-hand column shows the detail of the somatic membrane potential (solid line), the dendritic membrane potential (dashed line) and the calcium concentration (blue line) in a period of 30 ms around a burst or action potential. The middle column shows the behaviour of the membrane potential over 1000 ms. The right-hand column shows the behaviour of q, the IAHP activation variable, and the calcium concentration over the period of 1000 ms. The values of Is in mA cm-2 and gc in mS cm-2 in each row are: (a) 0.15, 2.1; (b) 0.50, 2.1; (c) 0.50, 10.5.
To recreate the data in panel (a):
- In the RunControl window click on Init & Run
- In Graph[0] (top) the membrane potential in the soma (black) and the dendrite (red) will appear. In Graph[2] (middle) the q variable appears. In Graph[1] (bottom) the dendritic Calcium trace appears.
To recreate the data in (b) change Is in the Parameters window to 0.0050.
To recreate the data in (c) change gc in the Parameters window to 10.5. To see the q trace you will need to right-click in Graph[2] and select View...->View=Plot.
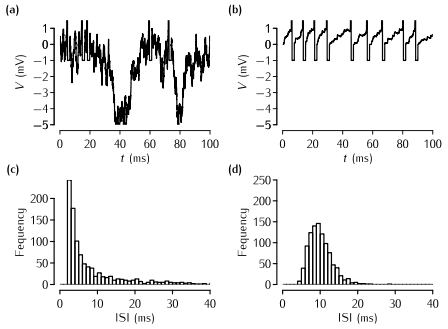
(a) The Stein (1965) model with balanced excitation and inhibition. The time course of the voltage over 100 ms of an integrate-and-fire neuron that receives inputs from 300 excitatory synapses and 150 inhibitory synapses. Each synapse receives Poisson spike trains at a mean frequency of 100 Hz. The threshold is set arbitrarily to 1 mV, the membrane time constant of the neuron is 10 ms, and there is a refractory period of 2 ms. Each excitatory input has a magnitude of 0.1 of the threshold, and each inhibitory input has double the strength of an excitatory input. Given the numbers of excitatory and inhibitory inputs, the expected levels of excitation and inhibition are therefore balanced. (b) The time course of a neuron receiving 18 excitatory synapses of the same magnitude as in (a). The output firing rate of the neuron is roughly 100 Hz, about the same as the neuron in (a), but the spikes appear to be more regularly spaced. (c) An ISI histogram of the spike times from a sample of 10 s of the firing of the neuron in (a). (d) An ISI histogram for the neuron shown in (b).
To reproduce the data behind panel (a) and (c):
- In the RunControl window click on Init&Run
- A trace of the membrane potential appears in the top window and at the end of the simulation the histogram appears in the lower window.
To reproduce the data behind panel (b) and (d):
- In the Parameters window change NE to 18 and change NI to 150.
- In the RunControl window click on Init&Run.
You can also explore the effect of changing the strength of the excitatory and inhibitory inputs by changing JE and JI in the Parameters window.
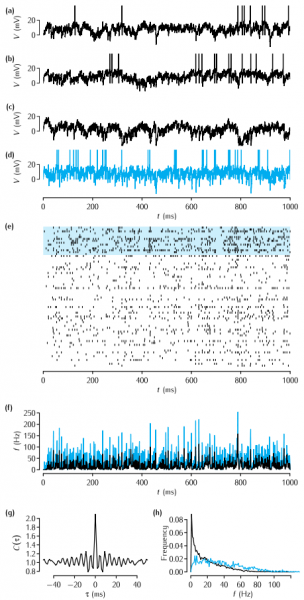
Our simulations of a network of recurrently connected excitatory and inhibitory neurons using Equations 9.3, 9.4 and 9.5, after Amit and Brunel (1997b). (a-c) The time courses of the membrane potential of three excitatory neurons. (d) The time course of one inhibitory neuron. (e) A spike raster of 60 excitatory neurons (lower traces) and 15 inhibitory neurons (upper traces, highlighted in blue). (f ) Population firing rates of the excitatory (black) and inhibitory neurons (blue). (g) Average autocorrelation of spikes from excitatory neurons. (h) Histogram of average firing rates of excitatory neurons (black) and inhibitory neurons (blue). Parameter values: θ = 20mV, Vreset = 10mV, τE = 10ms, τI = 5ms, wEE = 0.21 V s-1, wEI = 0.63 V s-1, wIE = 0.35 Vs-1, wII = 1.05 V s-1, Δ=0.1, τij is drawn uniformly from the range [0.5,1.5] ms and νextE = 13Hz.
To run this simulation, click on the Run button in the Control panel. The simulation is quite slow compared to others from this website - it will probably take a few minutes to run. The scale value in the Control panel indicates how big the network is compared to the one simulated in the book. The default is 0.5, i.e. there are half as many exicitatory and inhibitory neurons as in the simulations used to produce the figure in the book.
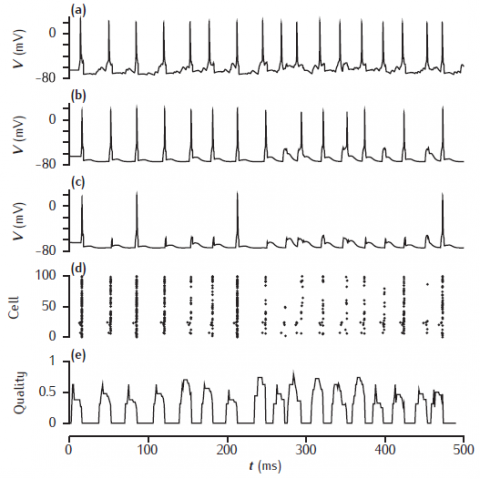
Network simulation based on the model of Sommer and Wennekers (2001). The top three traces are the time courses of the membrane potential of three excitatory neurons: (a) a cue cell, (b) a pattern cell and (c) a non-pattern cell. (d) a spike raster of the 100 excitatory neurons. (e) the recall quality over time, with a sliding 10ms time window.
Simulation produces somatic voltage plots from a cue cell, a non-cue pattern cell and a non-pattern cell. The "Spike plot" button on the menu panel will show a raster plot of all spiking activity during the simulation.
