Voltage response to a single synaptic EPSP at a spine on a dendrite. There are three spines 100 μm apart on a 1000 μm long dendrite of 2 μm diameter. EPSP occurs at spine 1. Black lines show the voltage at each spine head. Blue lines are the voltage response in the dendrite at the base of each spine. Dendrite modelled with 1006 compartments (1000 for main dendrite plus 2 for each spine); passive membrane throughout with Rm = 28 kΩ cm2, Ra = 150 Ω cm, Cm = 1 μF cm−2; spine head: diameter 0.5 μm, length 0.5 μm; spine neck: diameter 0.2 μm, length 0.5 μm. For a similar circuit see Woolf et al. (1991).
Figure 4.all
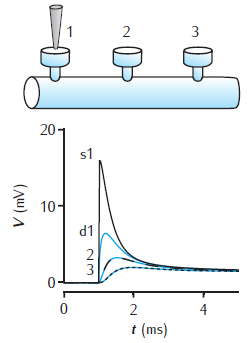
Spines on a dendrite
Simulation environment:
Download:
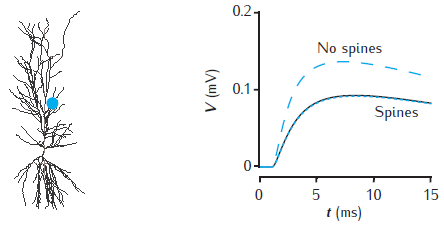
Effect of spines on somatic voltage response
Somatic voltage response to a single synaptic EPSP on a spine at a distance of 500 μm in the apical dendrites of a CA1 pyramidal cell model (blue dot on cell image). The voltage amplitude is reduced (black line) when 20,000 inactive spines are evenly distributed in the dendrites, compared to when no spines are included (blue dashed line). The somatic voltage response is corrected if Rm is decreased and Cm is increased in proportion with the additional membrane area due to spines
(blue dotted line). The CA1 pyramidal cell is n5038804, as used in Migliore et al. (2005); model has 455 compartments (with no spines); passive membrane throughout with Rm = 28 kΩ cm2, Ra = 150 Ω cm, Cm = 1 μF cm−2; spine head: diameter 0.5 μm, length 0.5 μm; spine neck: diameter 0.2 μm, length 0.5 μm; 20,000 spines increase the total membrane area by 1.4 and reduce the somatic voltage response by around 30%. For a similar comparison see Holmes and Rall (1992b).
Simulation environment:
Notes
Simulation starts with no spines. Use the "Control" panel (which may initially be hidden behind other windows) to add and delete spines, or to adjust membrane resistance and capacitance to compensate for spines. Note that adding spines may take several minutes and the subsequent simulation runs more slowly.
Download: